
Blog Post
How Tire Management Drives Fleet Efficiency and Cost Savings
By Brian Bolden
April 28, 2026
Baseline Tire Life: Not All Vehicles Wear the Same
Fleet readiness is often measured in uptime, service availability, and operating costs, but those outcomes frequently begin at the tire level. Using Wheels’ internal maintenance data spanning January 1, 2015 through December 31, 2025, we analyzed 148,614 aggregated tire replacement transactions across distinct vehicle identification numbers (VINs) to better understand what drives tire life across a modern fleet. The results show that tire wear is far from uniform. Average mileage between replacements varies meaningfully by vehicle type, fuel source, operating environment, and maintenance behavior. These differences can materially impact replacement timing, downtime risk, and cost as utilization rises during peak season.
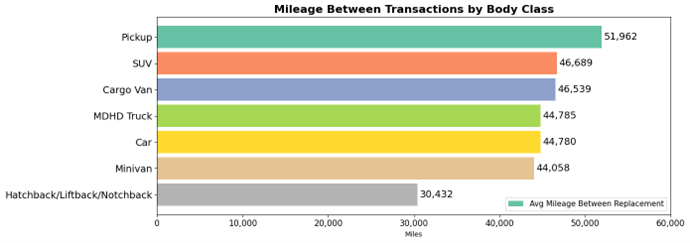
Across the analyzed fleet data, pickup trucks lead all vehicle types at 51,962 average miles between tire replacements. SUVs/MPVs and cargo vans follow at 46,689 and 46,539 miles, respectively, with cars and medium/heavy-duty (MDHD) trucks clustering near 44,780 and 44,785 miles. Hatchbacks, liftbacks, and notchbacks average just 30,432 miles per cycle, a gap of more than 21,000 miles compared to pickups. For fleets managing a mix of vehicle types, this variance has direct cost implications. Lighter-duty passenger vehicles require more frequent tire spend and more vigilant scheduling entering a high-utilization period.
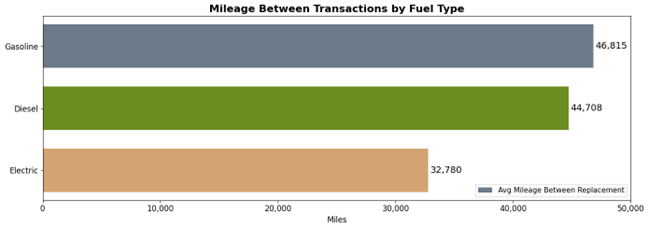
Fuel type adds another layer. Among the three primary vehicle propulsion types , gasoline-powered vehicles average 46,815 miles between tire replacements, with diesel vehicles close behind at 44,708 miles, a difference of roughly 2,100 miles that reflects the heavier load profiles of diesel-operated vehicles. Electric vehicles, however, tell a notably different story at 32,780 average miles, approximately 30% shorter intervals than their gasoline counterparts. This gap is driven by a combination of factors unique to EVs. The instant torque delivery of electric motors places higher shear stress on tires during acceleration, while the greater vehicle weight from battery packs increases the load carried by each tire contact patch. In addition, EV tires are often engineered for low rolling resistance, which can reduce tread volume and increase wear rates relative to standard all-season tires. For fleets with a growing EV presence, this means tire budgets and rotation schedules calibrated for internal combustion vehicles may systematically underestimate the service needs of electric assets. Understanding fuel type composition at the fleet level creates more accurate tire life benchmarks and more realistic cost expectations going forward.
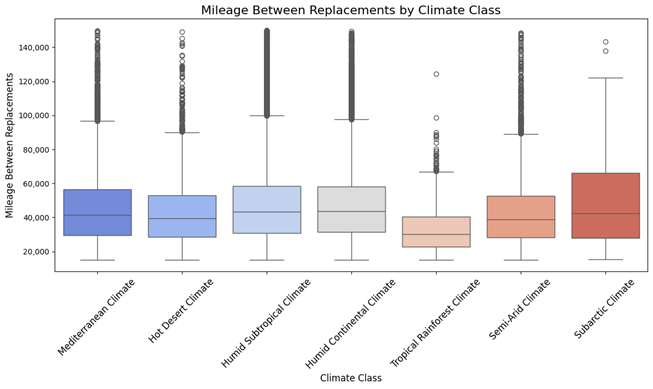
Operating environment plays a supporting role as well. Vehicles in tropical and arid climates show median tire life roughly 10,000-15,000 miles shorter than those in temperate environments such as Humid Continental or Humid Subtropical regions. Subarctic climates show the widest variance, reflecting a broader mix of vehicle types and conditions. As summer heat and UV exposure intensify across the southern and western U.S., fleets operating in those geographies face accelerated natural wear, making proactive tire inspection and rotation a higher-priority item, not a routine one.
Rotation Behavior: The Data Makes the Case
The most actionable finding in this dataset is not about the vehicle itself. It is about the maintenance behavior between replacements. Tires do not wear evenly across all four positions, and that unevenness is the primary driver of premature replacement. On front-wheel drive vehicles, the front axle bears the combined load of steering, braking, and propulsion, causing the front tires to wear significantly faster than the rear. On rear-wheel drive vehicles, the dynamic shifts to the rear axle, while all-wheel drive systems distribute load more evenly but still produce meaningful variation by position over time. The practical consequence is that a full four-tire replacement is often triggered when a single position (front or rear) crosses the legal or safety wear threshold, even if the other tires on the vehicle still have substantial life remaining.
Rotation interrupts this pattern by periodically redistributing each tire to a different position, equalizing tread depth across all four and delaying the point at which any single tire forces a replacement event. Usage intensity amplifies the effect in both directions: vehicles with higher monthly mileage accumulate positional wear faster, making rotation discipline more valuable. Conversely, vehicles with heavier duty cycles, larger body classes, higher loads, and more frequent stops place greater stress on the tires regardless of position. Understanding these mechanics is what motivated the analytical approach that follows: rather than treating tire replacement as a fixed interval event, we modeled it as an outcome shaped by rotation behavior, usage patterns, and vehicle characteristics, all of which proved to be statistically meaningful predictors.
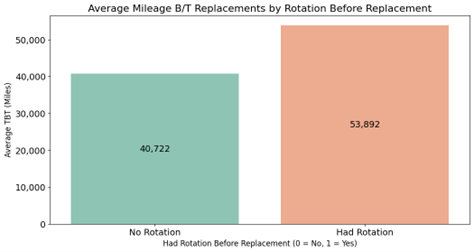
Fleet vehicles that received at least one tire rotation before their most recent replacement averaged 53,892 miles between replacements. Vehicles that received no rotation averaged just 40,722 miles. That is a difference of 13,170 miles (approximately 32% more usable tire life) associated with a single, schedulable maintenance behavior. At fleet scale, this translates directly into fewer replacements per vehicle per year, lower tire spend, and less unscheduled downtime.
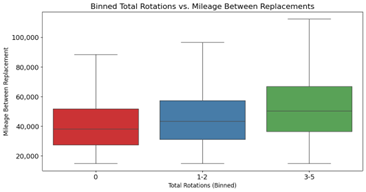
Looking across vehicles grouped by total lifetime rotation history of none, 1-2, or 3-5 rotations, the picture is consistent. Vehicles with no rotation history show the lowest median mileage between replacements and the most compressed range of outcomes. Those with 1-2 total rotations show a moderately higher median. Vehicles with 3-5 rotations show both the highest median and the widest upside distribution, with some extending well past 100,000 miles between replacements. This is not a story of outliers inflating the averages. The entire distribution shifts upward. Rotation-adherent vehicles are more likely to achieve longer tire life across the board, not just in exceptional cases.
To validate these patterns statistically, both a Welch’s t-test and a one-way ANOVA1 were performed comparing mileage between replacements across rotation groups. Both tests returned statistical significance at p < 0.0001, confirming the observed differences are highly unlikely to be the result of chance. As with any observational analysis, it is worth noting that vehicles receiving regular rotations may also benefit from more consistent overall maintenance practices. The data reflects a strong association, not a controlled experiment. That said, the consistency and scale of this signal across more than 148,000 tire transaction records spanning a decade of fleet operations lends the finding substantial practical credibility.
The tire industry has long held that three factors drive wear above all else: how a vehicle is used, how far along it is in its operational life, and whether rotations are kept up consistently. A predictive model built on Wheels’ own transaction history, drawing on vehicle characteristics, usage patterns, and maintenance behavior across the full dataset, confirmed all three with no surprises and no contradictions. Rotation behavior ranked among the strongest predictors of longer tire life, directly corroborating both the statistical findings above and the conventional maintenance guidance that fleets already know but do not always follow. Usage intensity, measured by average monthly mileage, was a second key driver: vehicles accumulating miles faster reached the replacement threshold sooner regardless of vehicle type which is consistent with the basic physics of tread wear under load. The value of a data-driven model is not that it discovers something the industry did not already suspect, but rather that it quantifies those suspicions using your own fleet’s history, removing the guesswork about which vehicles are most at risk and when.
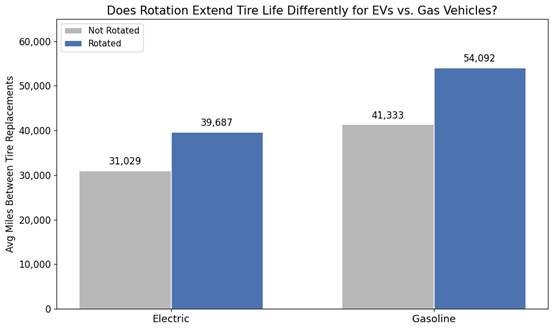
Electric vehicles in the fleet replaced tires roughly 25% sooner than comparable gasoline vehicles when neither group had prior rotations (31,029 vs. 41,333 miles, respectively), consistent with the additional torque stress and battery weight characteristic of EVs. However, the benefit of tire rotation was nearly identical across both powertrains: rotated EVs extended tire life by 27.9%, compared to 30.9% for gasoline vehicles, a difference that is not statistically meaningful. Importantly, this EV finding is statistically significant (p < 0.0001), despite the smaller EV sample. The practical implication is clear: rotation discipline is just as valuable for EVs as it is for gas vehicles, and given that EVs start at a shorter baseline, the cost of skipping a rotation is proportionally higher for an EV owner.
The cost picture reinforces this finding regardless of powertrain. Based on a decade of internal fleet tire transaction data, regular tire rotations reduce the effective cost of tire wear by 20% ($0.0134 vs. $0.0168 per mile). While rotated vehicles spend slightly more per replacement event on average ($632 vs. $595), those tires last approximately 13,000 miles longer, meaning each dollar goes significantly further. Assuming average per-event spend holds consistent with what we observe in our own transaction history (a reasonable assumption given the sample size of nearly 149,000 replacement events), a vehicle driving 25,000 miles per year that skips rotations will incur roughly $420 per year in tire wear cost, compared to $335 for a vehicle that rotates regularly. That is an $85 difference per vehicle annually, even before accounting for the labor and downtime costs associated with unplanned or accelerated replacements. Taken together, the data presents a straightforward case: consistent rotation adherence is one of the highest-return, lowest-cost levers a fleet manager has control over.
What This Means for Your Fleet
The findings suggest a practical and high-impact playbook for fleets preparing for peak summer demand. The period between now and the height of summer utilization is the ideal time to complete tire rotations for vehicles that have not received one in the current cycle, particularly those accumulating mileage quickly or approaching replacement thresholds. Hatchbacks and electric vehicles, which show the shortest baseline tire life intervals in this analysis, warrant closer scheduling attention. However, the broader takeaway applies across every fleet segment. Cars, trucks, vans, and SUVs all benefit when tire wear is actively managed rather than passively monitored.
Fleets operating in high-heat or arid environments should also treat tire readiness as a weather-related priority, not solely a mileage-based one. The data indicates that geography can materially reduce expected tire life, and summer conditions often intensify that effect. Most importantly, rotation compliance tracked at the individual VIN level, rather than by calendar date alone, is the metric most closely tied to better outcomes. The difference between a fleet that reacts to tire failures and one that prevents them is often a matter of scheduling discipline, operational visibility, and timely intervention. Fleets that know which vehicles have gone the longest without rotation can act before wear becomes visible, before summer demand peaks, and before reactive replacement costs overtake the minimal cost of preventive service.
1 Welch’s t-test and one-way ANOVAare commonly used statistical tools that test whether differences between groups are likely real or simply due to random variation. Here, they were used to validate differences in mileage between tire replacement groups based on tire rotation history.