Open-end TRAC leasing of corporate fleet vehicles, rather than purchasing, historically has afforded North American companies many financial advantages. These benefits include financial flexibility of spreading costs over time, reduced capital outlay, equity ownership, turn-in flexibility, and until recently, low and predictable lease costs – even where variable lease rates are concerned.
The lease cost is what the lessee (you) pays the lessor (i.e., a fleet management company). This cost generally begins in the month a vehicle is activated and continues until the vehicle is paid down or turned in, whichever comes first. The calculation generally is:
Monthly Lease Cost = Monthly Lease Rate X Remaining Book Balance (what you owe)
However, there may also be a New Car Carry (NCC) charge that can be significant for vehicles requiring upfit. Typically, a NCC charge starts accruing when the lessor funds the vehicle and continues while the vehicle is upfit and until the vehicle is delivered, the Number of Carry Days. The NCC Charge formula is generally:
NCC Charge = Vehicle Funded Price X Daily NCC Rate X Number of Carry Days
Today, with the recent rise in lease rates, both lease cost and NCC charge are under the TCO spotlight and wreaking havoc on budgets and forecasts. The good news is that analytics are being used to manage the impact of lease rates on NCC and reduce these charges.
In this analysis, I’ll explain how adjusting the timing of NCC charges can help reduce your TCO. While some of the details may require a bit of extra time to absorb, especially for those new to fleet management, the insights will be worth the read.
How NCC Charges Became a Budget Disrupter
As the fleet industry emerged from the COVID era, recipients of NCC charges began feeling the hit of a “triple whammy.” (Refer to the NCC Charge formula, above.)
First, new car price increases accelerated, with manufacturers charging near MSRP prices while offering fewer incentives. Additionally, as a result of part and labor shortages, some vehicle segments saw body upfit and transport times rapidly increase, resulting in the average Carry Days more than doubling. Finally, since March of 2022, interest rates have steadily risen to levels not seen in 25 years. Some companies are now paying rates that are 3-4 times higher than just a few years ago.
This triple impact has put the spotlight on NCC charges. It has also put a focus on understanding the vehicle order-to-delivery process. With the right analytics, this process may be measured and managed.
Measuring Order-to-Delivery (OTD) Process
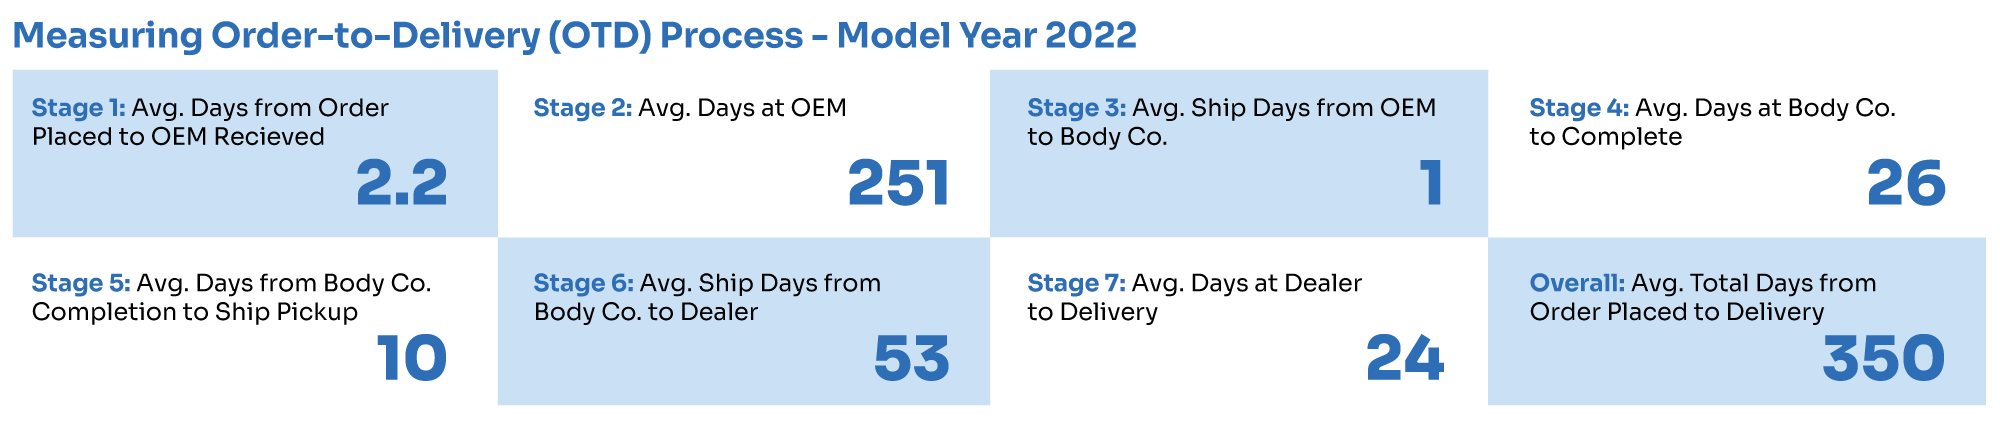
Key action dates in the OTD process may be used to breakdown the process into stages. In doing so, each stage may be effectively measured and managed. First, let’s define the stages. The stages may vary based on the dates tracked with the fleet management system being used, as well as by other factors such as order type and transport method.
Stage 1: Order Placed Date to Order received by OEM Date
Stage 2: Order received by OEM Date to OEM Ship Date (to Body Company)
Stage 3: OEM Ship Date (to Body Company) to Body Company Receipt Date
Stage 4: Body Company Receipt Date to Upfit Complete Date
Stage 5: Upfit Complete Date to Transport Pickup Date
Stage 6: Transport Pickup Date to Dealer Receipt Date
Stage 7: Dealer Receipt Date to Vehicle Delivered Date Below is a dashboard illustrating these stages.
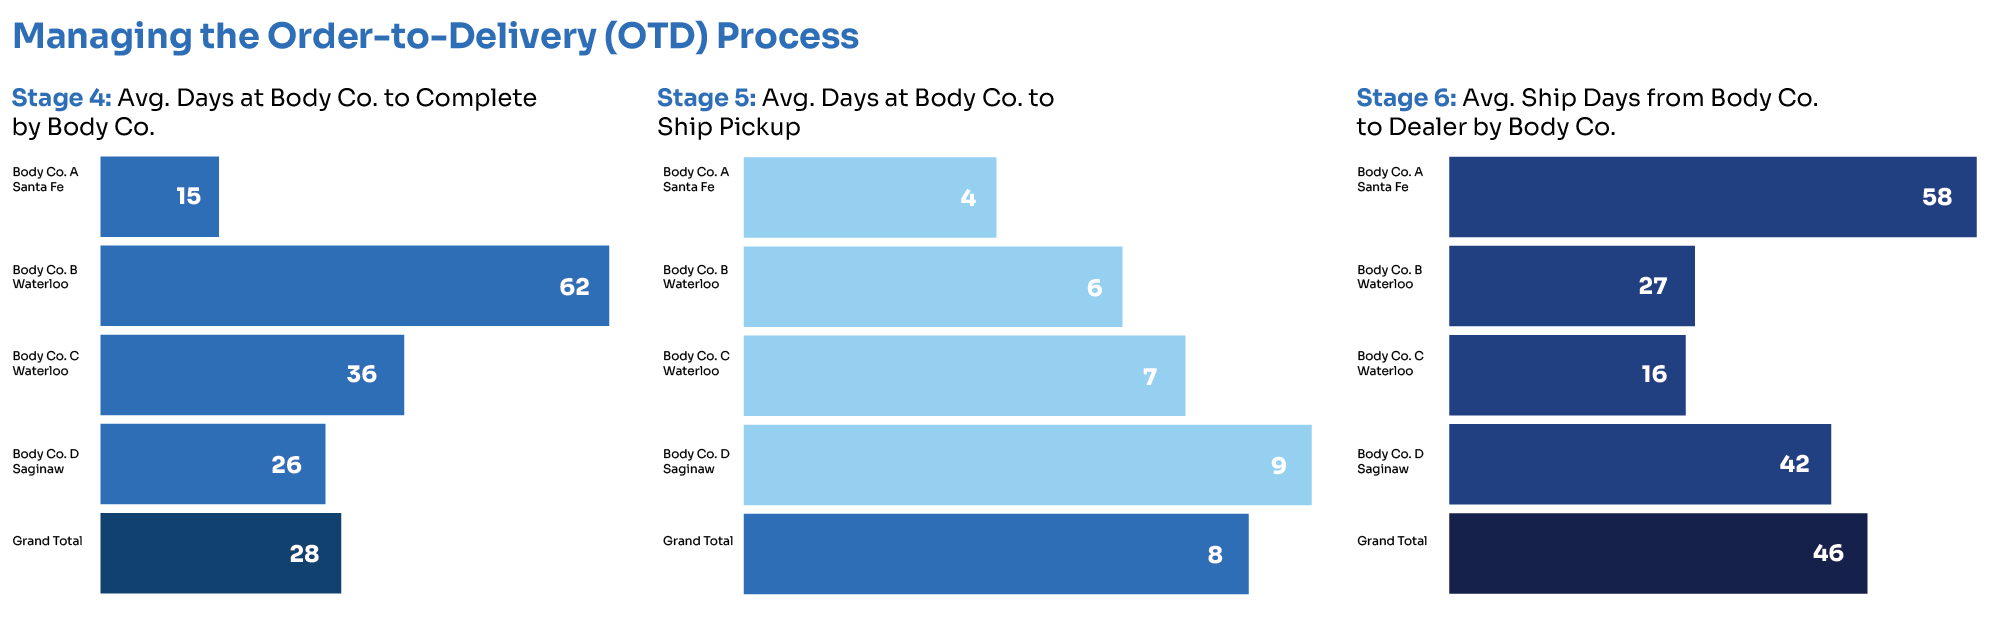
Managing the Order-to-Delivery (OTD) Process
With the stages defined and the OTD process being measured, attention can now more effectively be turned to managing strategies to reduce the overall OTD days and, in turn, reduce NCC charges.
NCC days generally accrue from Stage 4 through Stage 7. This can vary based on funding and contract dates. Applying strategies to reduce the time spent in each of these stages becomes critical. It is important to understand how body company locations in relation to transport destinations, as well as ship-to and ship through options, can work to reduce shipping times in Stage 5 and Stage 6. Data used to rate body companies against each other can be useful in reducing upfit time in Stage 4.
Below is a dashboard visually illustrating how body companies may be compared in Stage 4.
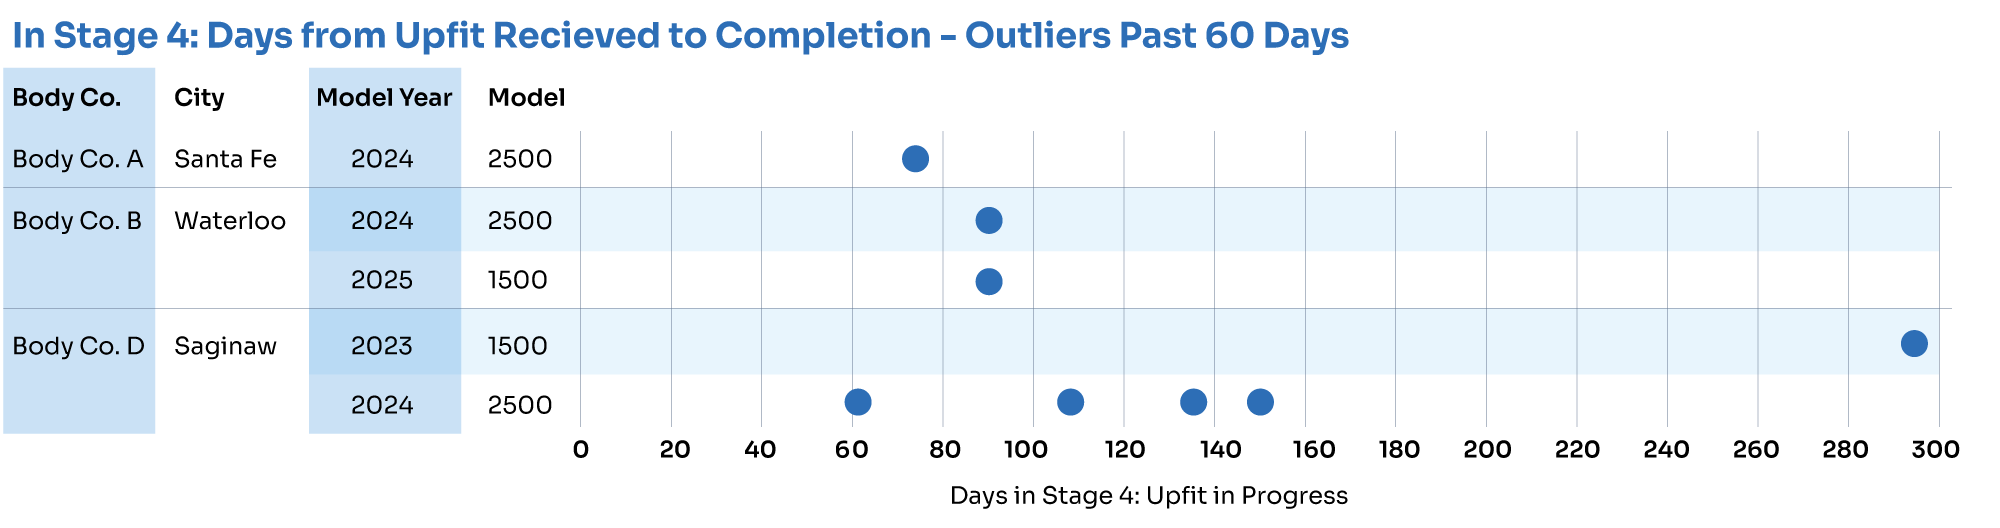
Understanding Outliers
Finally, understanding where vehicle “outliers” occur in each stage becomes an opportunity to manage these vehicles and reduce overall average times.
Below is a dashboard visually illustrating vehicle “outliers” in Stage 4:
Conclusion
The chart below illustrates the results of managing this process year-over-year. By using analytics to measure and manage the order-to-delivery process, overall OTD times can be reduced while saving a company thousands of dollars annually in New Car Carry charges.
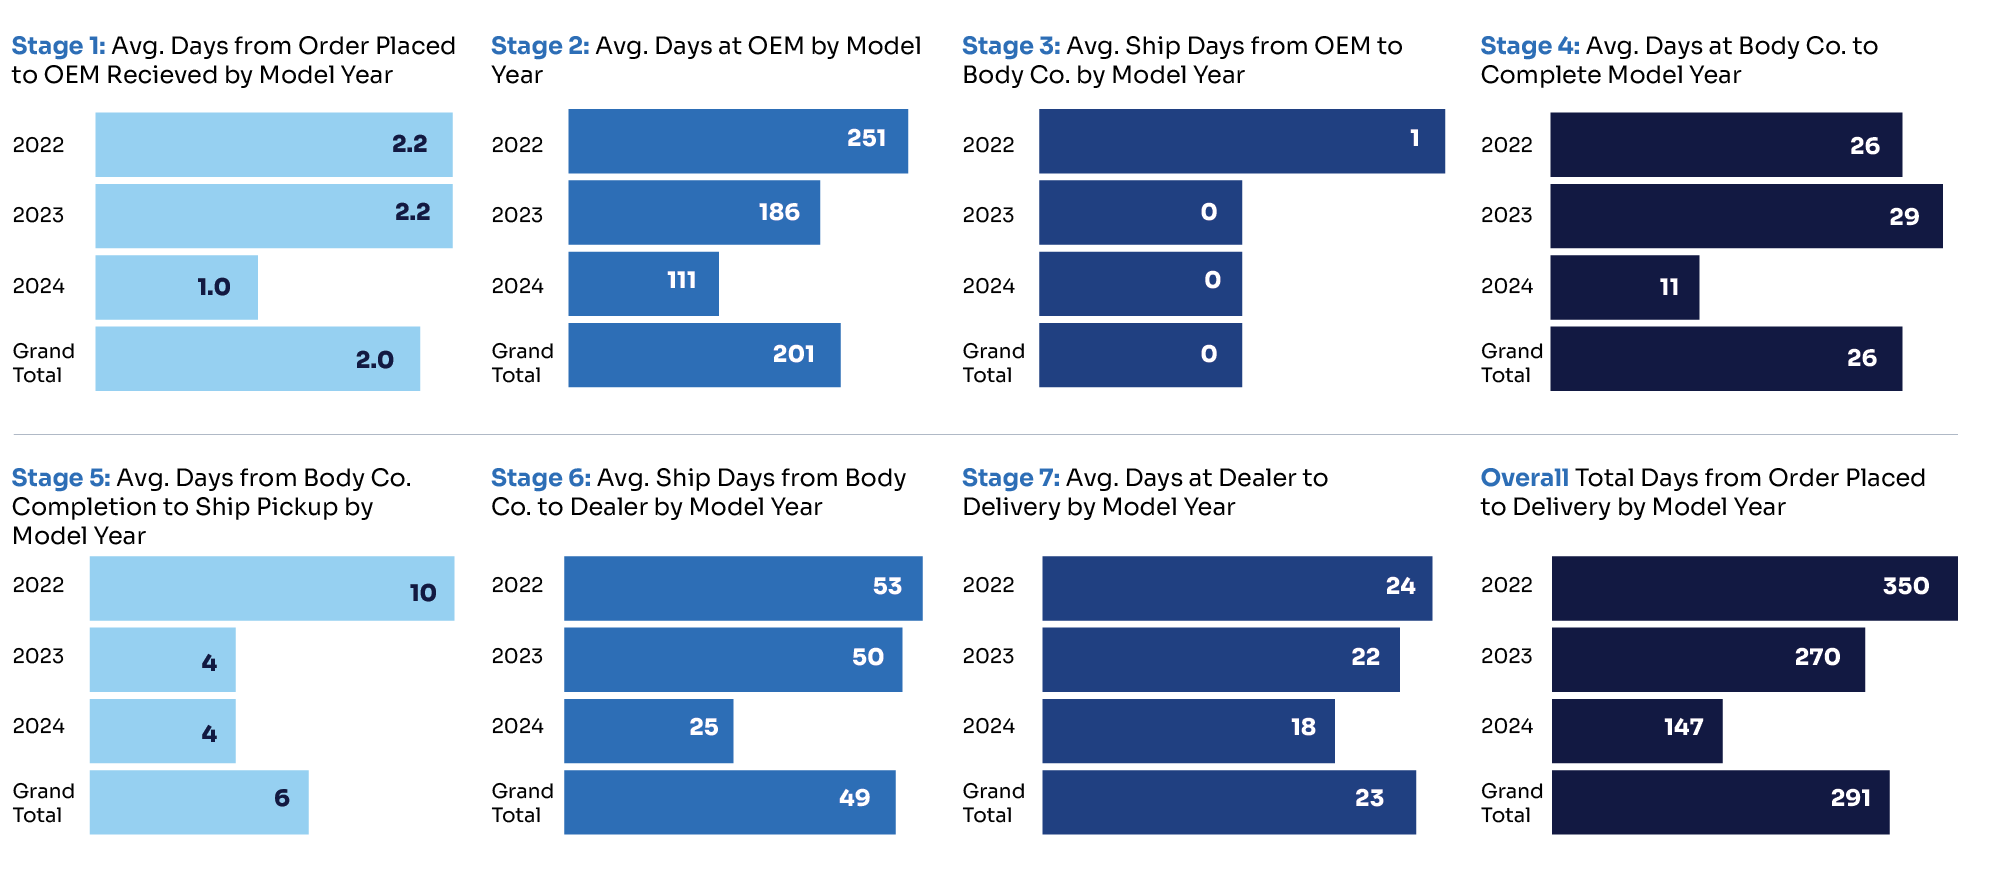
As of this writing, new car prices have stabilized and there is speculation that rate cuts loom ahead. Soon, the “triple whammy” may be somewhat reversed. Regardless, the methodologies discussed should remain effective in measuring and managing the OTD process, while minimizing the impact of unsuspected lease rates. While fleet professionals cannot manage interest rates, they can implement these methodologies and have a strategy for mitigating risk. If you would like further guidance on this topic, contact Wheels.